Analytics
Analytics
Review conversation volume, recurring topics, customer sentiment, and support quality in Muchat reports.
Overview
Analytics brings together your agent’s conversation activity. In the Muchat dashboard, select an agent and open Reports and exports. The menu contains four reports: Chats, Topics, Sentiment, and Support quality.
Each report covers the selected agent, with Past week selected by default: today and the six preceding days.
What you can do
Follow changes in conversation volume, find recurring questions, review customer sentiment, and assess operator performance and survey results.
Chats
The top of Chats contains five metrics. Select a card to show that metric in the chart below it.
| Metric | What it measures |
|---|---|
| Total conversations | Conversation segments started during the selected period. Returning to an earlier conversation can create a new segment and increase this count. |
| Total messages | Recorded public messages from customers, the AI, and operators, based on when each message was sent. This includes messages sent during the period in conversations that started earlier. |
| Thumbs up | AI messages sent during the period that currently have a positive reaction. |
| Thumbs down | AI messages sent during the period that currently have a negative reaction. |
| Resolution rate | The share of closed conversation segments started during the period that currently have no assigned operator. |
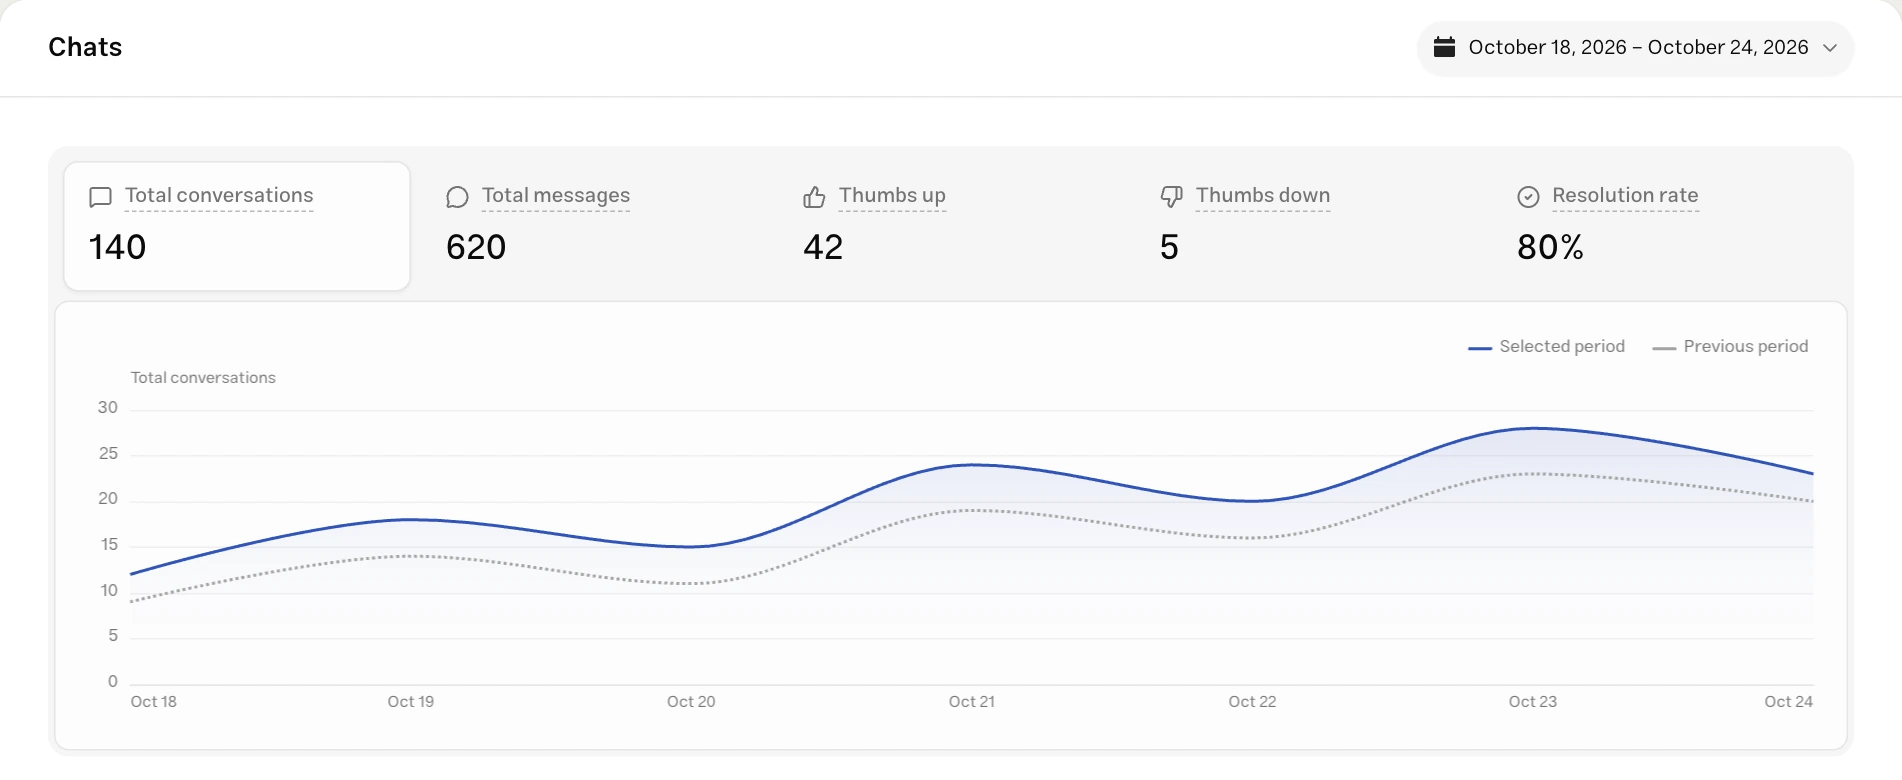
Total messages is different from credit usage. It includes customer and operator messages as well as recorded AI messages; private notes, system events, deleted messages, failed deliveries, and unfinished generations are excluded. Check Usage for consumed credits.
Feedback reflects the current reaction on a message, attributed to the date the message was sent. Changing a reaction later can therefore change an earlier period’s totals.
Resolution rate
For conversation segments started in the period, Muchat separates the segments currently closed without an operator from those currently closed with an operator assigned. The rate is the first count divided by the sum of both counts. Open segments are excluded; if none are closed, the rate appears as —.
When Resolution rate is selected, the chart shows the counts for Closed without an operator and Closed with an operator. The chart shows counts, while the card shows a percentage.
Comparing periods
For conversation volume, messages, and feedback, the solid line shows the Selected period and the dotted line shows the Previous period. The previous period is the same number of days immediately before your selection. Hover over a point to compare its value and date with the corresponding point in the previous period.
Active users
The next panel has three cards, each with its own chart:
- Daily active users: the average daily number of distinct contacts who sent a public message during the selected period.
- Weekly active users: the average of the daily rolling seven-day active-contact counts. Each day includes that day and the preceding six days.
- Returning users rate: the percentage of contacts starting a conversation segment during the period who also have an earlier segment. Each contact is counted once in the period.
These counts use recorded contact identities. Several messages from the same contact do not create several active users, and the daily and weekly figures are averages rather than a sum of unique contacts across the entire period.
Countries, channels, and actions
Chats by country shows a shaded world map and the leading countries. View all opens the full ranking. Country comes from the recorded visitor location associated with the conversation; conversations without a recorded country appear as Unknown in the list.
Chats by channel groups conversations by their source, such as Widget / Iframe, Standalone, Playground, or a connected messaging channel. Playground conversations are included in the reports, so testing can affect your totals.
Action calls ranks recorded agent-action runs by how often they started during the period. Use View all for the full list. This is a count of runs, rather than successfully completed requests; system actions and suggested-reply display actions are excluded.
Filtering
Use the date picker at the top of each report. Choose Today, Yesterday, Past week, Month to date, Past 4 weeks, Past 12 weeks, Year to date, Past 6 months, or Past 12 months. For a specific period, choose Custom, set From and To, then click Apply.
Date ranges include both their first and last day and can contain between 1 and 366 days. Day boundaries follow your browser’s time zone. The Persian dashboard uses the Persian calendar; the English dashboard uses the Gregorian calendar. Charts use daily points for ranges up to 90 days and monthly points for longer ranges.
Topics
Topics shows the subjects found in conversations. Topics can have subtopics: for example, a Payments topic can contain Refunds and Invoices. The chart groups subtopics under their parent topics.
The card at the top shows Total topics, including registered subtopics. The chart and its adjacent list show topics that have conversations in the selected period.
- Graph: follows the main topics over time. Use Show to switch between % of chats and Number of chats.
- Treemap: displays topics as tiles sized by their conversation counts, with subtopics nested inside their parents. Hover over a tile to see its path and value.
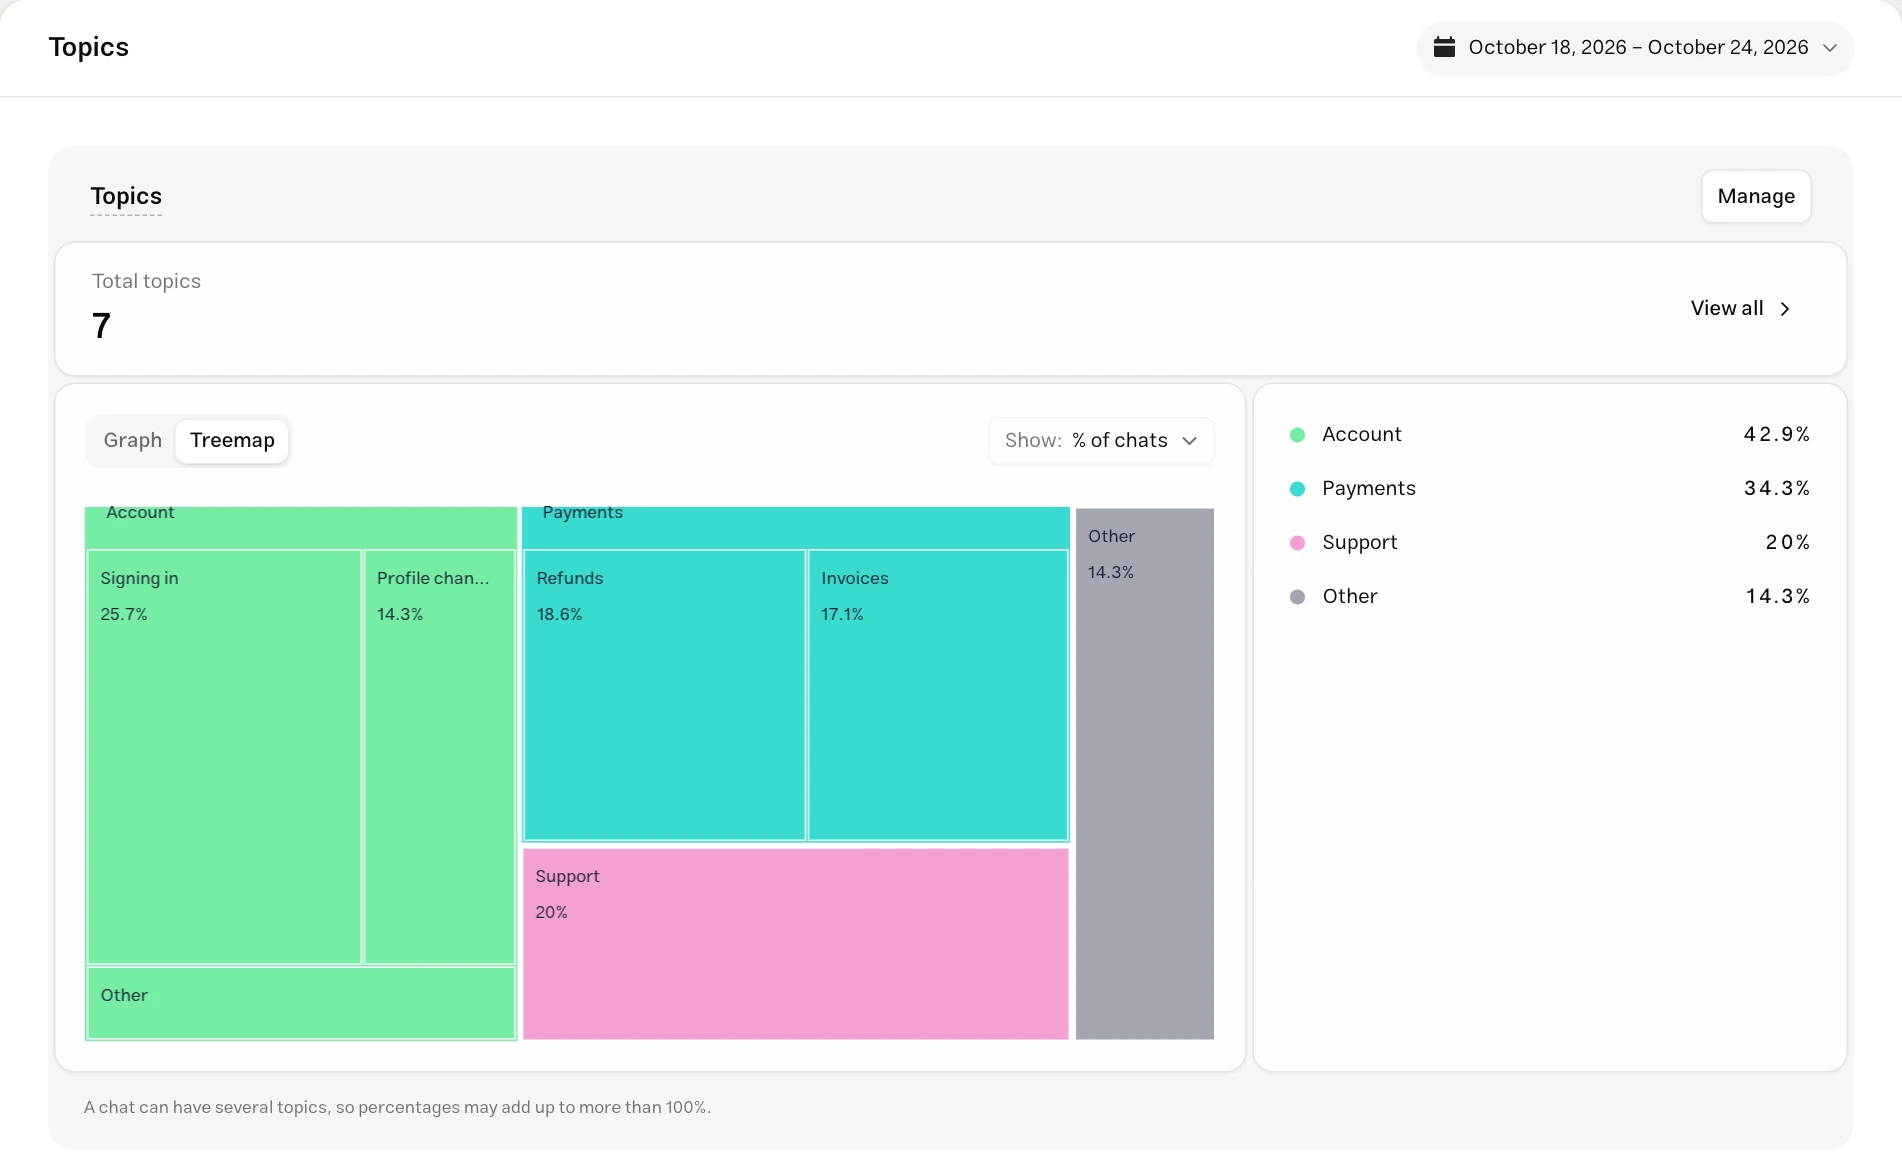
A conversation can have several topics, so the percentages can add up to more than 100%. A parent topic counts a conversation once even if it matches several of its subtopics; the subtopic counts can therefore exceed their parent’s count when added together.
Other outside the topic hierarchy represents conversations without an identified topic. Within a parent tile, Other represents conversations attributed to that parent without a matching subtopic. These are different groups.
How topics are found
Muchat analyzes eligible closed conversations after their reopening window has passed. Analysis runs in background batches and assigns existing topics; when automatic discovery is enabled, it can also suggest new topics. New suggestions are organized into the topic hierarchy in a separate nightly process before they appear in the report.
If the report says No conversations with an identified topic in this period, check the date range and allow eligible closed conversations to finish processing.
Manage topics
Click Manage or View all to open Manage topics. Search by name or sort the list by Name or Count. Subtopics show their parent path beneath their names.
Add a topic or subtopic
Click Add topic, enter a name, and choose Parent topic. Select None (top-level topic) for a main topic. You can also choose Add subtopic from a topic’s menu to preselect its parent. Confirm with the checkmark or press Enter.
Edit a topic
Open the topic’s menu and choose Edit. Update its name or parent, then confirm with Save changes. Cancel with the cross button to leave that edit unapplied.
Delete a topic
Choose Delete from its menu. A topic with subtopics cannot be deleted until those subtopics are removed or moved to another parent.
Each confirmed add, edit, or delete is saved separately. Closing the panel does not undo changes already saved. Names can contain up to 255 characters. A topic that already has conversations directly assigned to it cannot become a parent by adding or moving a subtopic beneath it; choose an unassigned parent topic instead.
Freeze topics pauses discovery of new topics while retaining classification into existing topics. The switch saves immediately. Manually created topics and names you set remain under your control.
Deleting archives the topic and removes it from the active report. Its conversations remain available in the Inbox.
Sentiment
Sentiment groups conversations into Positive, Negative, Neutral, and Unspecified. Select a card to compare its trend with the previous period.
The AI determines sentiment during the same background processing used for closed-conversation analysis. Open conversations, conversations still waiting for analysis, and conversations without enough useful content can appear as Unspecified.
Sentiment is an interpretation of the conversation’s tone, separate from a customer’s thumbs-up reaction or survey response. To investigate a result, read the conversation in the Inbox.
Support quality
Support quality contains Operator performance and Survey results (CSAT) for the selected agent and date range. It helps you review the team’s work alongside customers’ submitted ratings.
Operator performance
The table shows each operator’s contribution during the period:
| Column | What it measures |
|---|---|
| Resolved conversations | Distinct conversations with a resolution attributed to that operator during the period. |
| Conversations answered | Distinct conversations in which the operator sent at least one public reply during the period. |
| Messages sent | The operator’s public replies sent during the period. Private notes, system messages, and AI replies are excluded. |
| Median time to first reply | The median time from the conversation’s start to that operator’s reply when it was the first operator reply in the conversation. |
| Median time waiting for a reply | The median wait from the first customer message after the preceding operator reply to the next operator reply. Replies without a preceding customer message are excluded from this duration. |
| Median time to resolution | The median elapsed time from the conversation’s start to its resolution attributed to an operator. |
Click a column heading to sort it. The Total row aggregates the team; a conversation answered by several operators can appear in several rows but counts once in the team’s answered-conversation total. A dash means there is no duration to calculate for that entry.
Medians show the middle observation: half the measured times are shorter and half are longer. A few unusually long waits therefore have less influence than they would on an average. Times use elapsed time, without subtracting hours outside your working schedule.
Customer satisfaction (CSAT)
Survey results (CSAT) summarizes the ratings received through your CSAT form action:
- Satisfaction with support: ratings of 4 or 5 as a percentage of all submitted ratings.
- Dissatisfaction with support: ratings of 1 or 2 as a percentage of all submitted ratings.
- Survey participation: submitted ratings as a percentage of surveys sent.
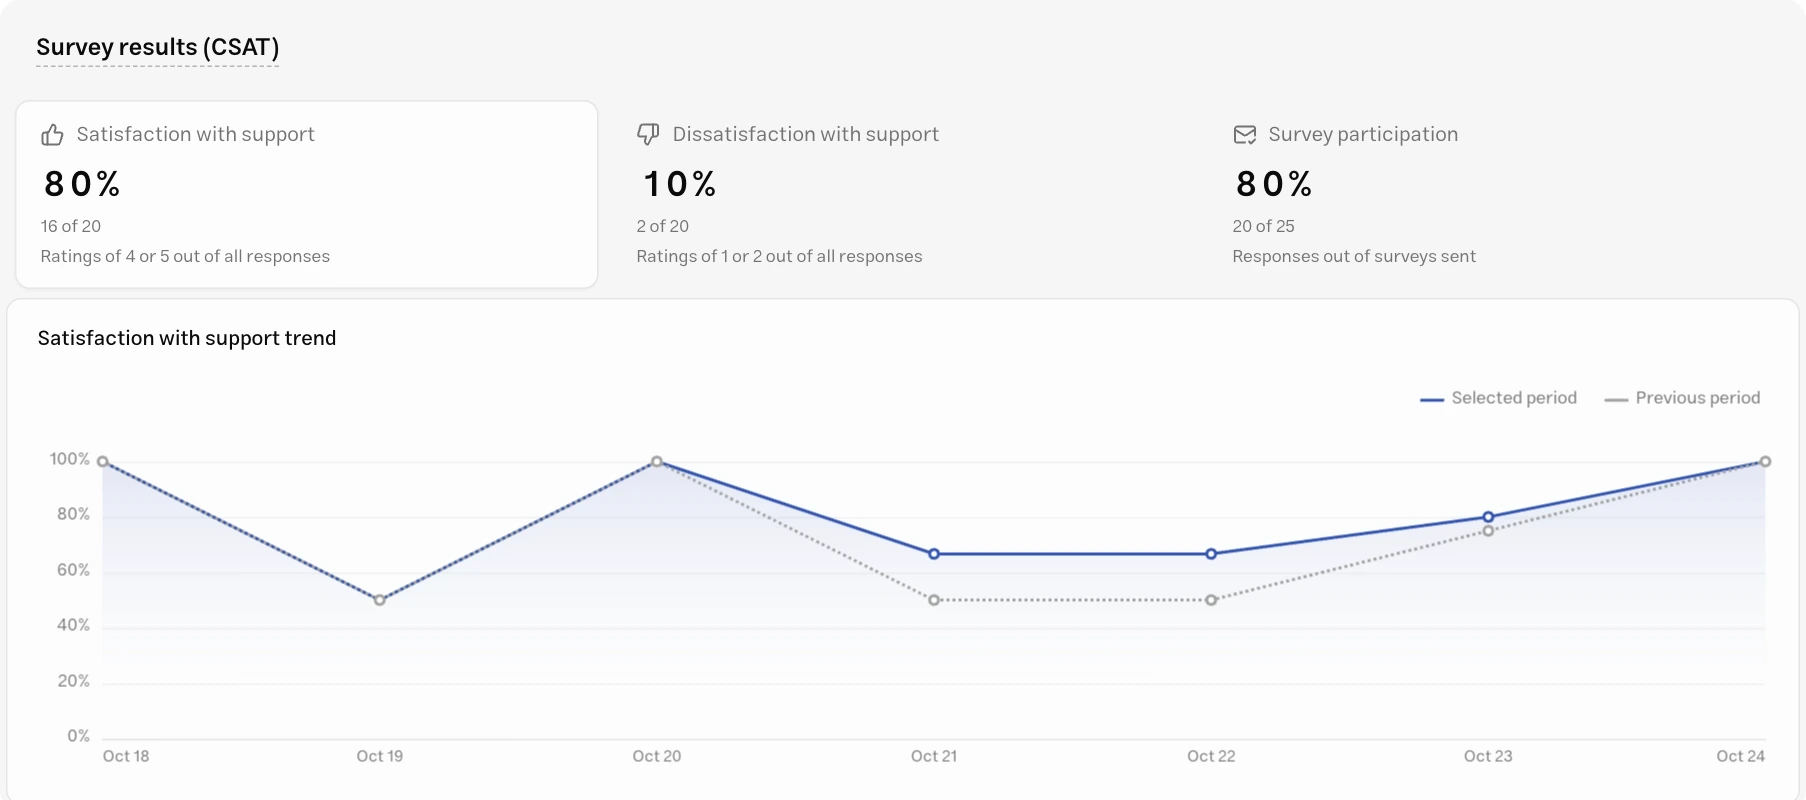
Each card shows its count and denominator. A rating of 3 is included in submitted ratings but in neither the satisfied nor dissatisfied count, so those two percentages do not have to add up to 100%.
Select a card to show that metric’s trend against the previous period. Survey results are grouped by when the survey was sent in your browser’s time zone; a later answer updates the original survey period. If no surveys were sent, the report shows an empty state. If surveys were sent but have no answers, participation can be zero while satisfaction and dissatisfaction remain —.
Data exports
To download a CSV of conversation details, contacts, or form submissions, open Reports and exports → Data exports. Select New export, choose the report content and recipients, set the date range for a One time export, and submit the request. Once the export is ready, select Download and open the CSV in Excel.
Conversation report exports do not include message text. To download the messages, use conversation export in the Inbox.
Troubleshoot an export file
If all data appears in column A, Excel has not recognized the comma (,) delimiter. This can happen with report CSVs or conversation transcript CSVs. In the desktop version of Excel:
- Click the A heading to select the entire column.
- Open the Data tab and choose Text to Columns.
- Choose Delimited, then Next.
- Enable only Comma as the delimiter and check Data preview to confirm that the data appears in separate columns.
- Choose Next, then Finish.
You can now read and review the exported data in separate columns.
Next steps
Inbox overview
Read the individual conversations behind the reports and improve an answer.
Usage
Review credit consumption separately from conversation and message counts.
CSAT action
Configure the survey used to collect customer ratings.
Best practices
Use the findings to improve instructions and knowledge sources.